
For a brand to succeed in today’s digital landscape saturated with competition, knowing their digital audience and how they react is a must. The best way to achieve this goal is through web analytics.
Web analytics can help any brand – big or small – understand how their audience enters and behaves on their site. Analyzing this data, brands can tailor a marketing strategy geared toward their audience, allowing them to achieve their specific business objectives.
Related Post: How to Build Your Brand Through Digital Marketing ➢
Google Analytics Interface
Once you select the desired site, you’ll land on the reporting dashboard, as seen in the snapshot below:
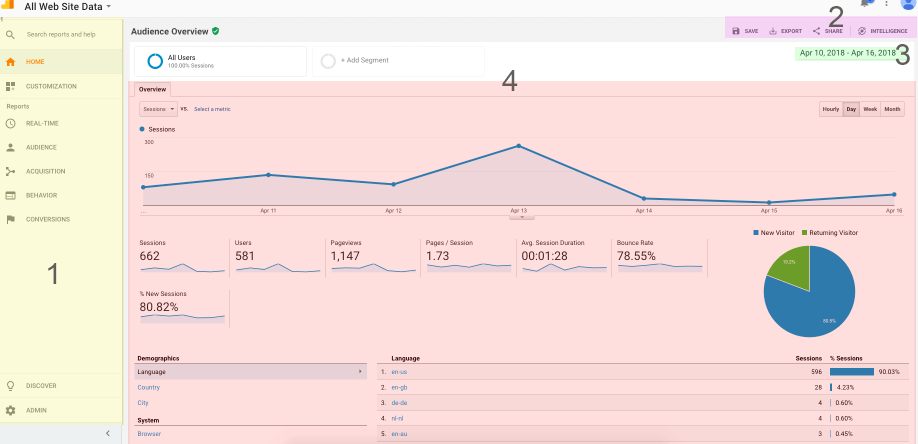
- Reports Menu: An Overview of the key categories of your Google Analytics report.
The Google Analytics report is categorized into four main parts:
Audience Report –> what are the characteristics of users visiting your site?
Acquisition Report –> how do you acquire users? How many? From where?
Behaviors Report –> how do users behave on your site?
Conversion Report –> do users take a desired action on the site? - Auxiliary Menu: Option to save, export data into a spreadsheet, share data and intelligence (insights from Google).
- Time-Period (Date Range): The date range selector is at the top right of every page. By default, Google Analytics will show data for the past 7 days. Click the arrow next to the existing date range to open the selector. Once you’ve selected a new date range, click “apply” to update your report.
- Graphs and Tables: This area will show graphs and tables of the metrics from the report you choose from the reports menu.
Now let’s break down the four main categories.
Audience
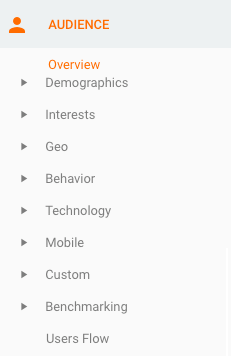 The audience report gives you a quick overview of your website’s overall performance, including the number of sessions, users (both new and returning), page views, average session duration, bounce rate, user locations, device information, and the operating system used by your users. Below are the most useful reports from the audience category:
Demographics: The demographics report will show the age and gender of users. This report is not enabled by default.
GEO: The GEO report will show traffic segmented by language or location (country, state, city).
Behavior > New and Returning Visitors: This report provides information about the total number of visitors your website receives and breaks it down further into new vs. returning visitors.
Technology > Browser and OS: This report provides information about what browsers and operating systems your site’s visitors have used.
Mobile > Overview: This report provides information regarding the device people have used to access your site (desktop vs. mobile vs. tablet).
Acquisition
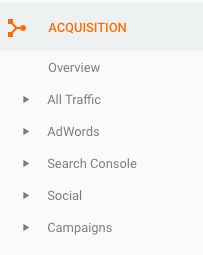 Up next is an overview of your website’s top channels generating traffic. These include direct traffic, organic search, referral, social media, display advertising, email and paid search (i.e. AdWords). Below are the most useful reports from the Acquisition category:
Channels: This section provides information regarding the different traffic mediums such as organic, referral, paid, social and others. Which channel has the best conversion rate and why?
Referrals: The referrals report provides information about the segment of your web traffic that arrives through another source, such as a link on another website.
AdWords: This report provides information about your current and past AdWords campaigns. What is your best performing campaign? Which campaign has the highest bounce rate?
Related Post: PPC vs. SEO: Which One Should I Focus On? ➢
Behavior
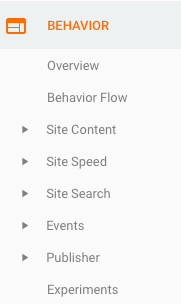 What good are analytics if you can’t track behavior (still good, but that’s not the point)? Fortunately, that’s not a concern you’ll have because it just so happens to be that the behavior overview report reveals what pages people visit on your website and what actions they take while visiting. It also provides information about user behavior flow, pageviews, bounce and exit rates, page speed insight, site search, and events. Below are the most useful reports from the behavior category:
Behavior Flow: The behavior flow report visualizes the path user’s travel as they go from one page or event to the next. This report can help you discover what content keeps users engaged within your site, and also identify potential issues with content.
Site content > All Pages: This report provides information about what the most visited web pages of your website are. Are your most important pages being viewed?
Landing Pages: The landing page report provides information about the first page people visit when they land on your site. These pages (outside the homepage) are mostly reached via organic search. What is your most viewed landing pages and how can you mimic this success?
Exit Pages: The exit page report provides information about the last page people visit before they leave your site. Is the user getting stuck? Do these pages need calls to action to push the user further down the sales funnel?
Site Speed: The site speed report provides information about the time it takes for your site’s pages to load. It also provides suggestions you can make use of to improve your pages’ average load time.
Site Search: The site search report provides information about the search queries that visitors use to find products or pages on your site. Is there a common theme a new page or FAQ section can solve? Keep in mind that you’ll need to enable site search functions to make use of it.
Events: Events are user interactions with your site’s content. Events provide information regarding your visitors’ activities such as downloads, mobile ad clicks, gadgets, Flash elements, AJAX embedded elements, and video plays. We suggest events being set up via Google Tag Manager.
Conversions
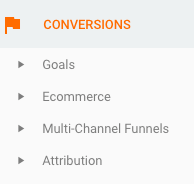 You can’t forget conversions. These include form filling, product sales, or any other activity that achieves a business objective. For monitoring purposes, the conversion goal overview report reveals the status and completion of goals. Each goal has to be manually set up.
Learn how Parqa can help positively impact your business’s online presence
Glossary of Terms
Session/traffic:: A session is when a user visits a website and spends time browsing through pages and then leaves.
Direct Traffic: visits from users who either type the URL in directly or reach the website via bookmarks. Links in work email will work as a bookmark link.
Organic Traffic: visits from organic searches (Google, Bing) and not from paid (ads).
Referral Traffic: visits from links on other sites.
Social Traffic: visits from known social websites (Facebook, Twitter, Instagram, LinkedIN)
Email Traffic: visits from email with URLs tagged correctly with tracking parameters.
Pageviews: How many times a web page has been clicked on and loaded.
Unique pageview: aggregates pageviews that are generated by the same user during the same session.
Unique visitor: This term refers to a user who visits your website more than once within a specific time period (e.g. a month).
Average session duration: The average time users spend on a page. Google Analytics measures this by calculating the time between one page being viewed and clicking on another page on your website. This means that if someone spends 20 minutes thoroughly reading a blog post and then leaves the site from that page, Google Analytics will not record that time.
Goal: Goals can be set up in Google Analytics to track conversions. They relate to a quantifiable action that your website visitors can take that you deem a success. For example, buying a product, signing up to your newsletter, or downloading a PDF are all goals.
Conversion: This is when a user does something that you want them to do (goal) such as purchasing a product, completing a contact form, etc.
Goal conversion rate: This is the percentage of visits on a site during which the user completes one of your goals (e.g. buying a product).
Bounce rate: Percentage of users who visit a page on your website and leave.
Custom reporting: Google Analytics has the option to create custom reports based on the metrics and dimensions you’ve selected. Custom reports present the information you have selected in a way that works for you.
Exit page: The last page a user views on your website.
Filters: A means of controlling or changing the data that appears.
Events: Events are user interactions with content that can be tracked independently from a web page or a screen load. Downloads, mobile ad clicks, gadgets, Flash elements, AJAX embedded elements, and video plays are all examples of actions you might want to track as Events
Landing page: This is the page that users first see during their session, also known as an entrance page.
Percentage of new sessions: The percentage of overall users that were first time users to your site.